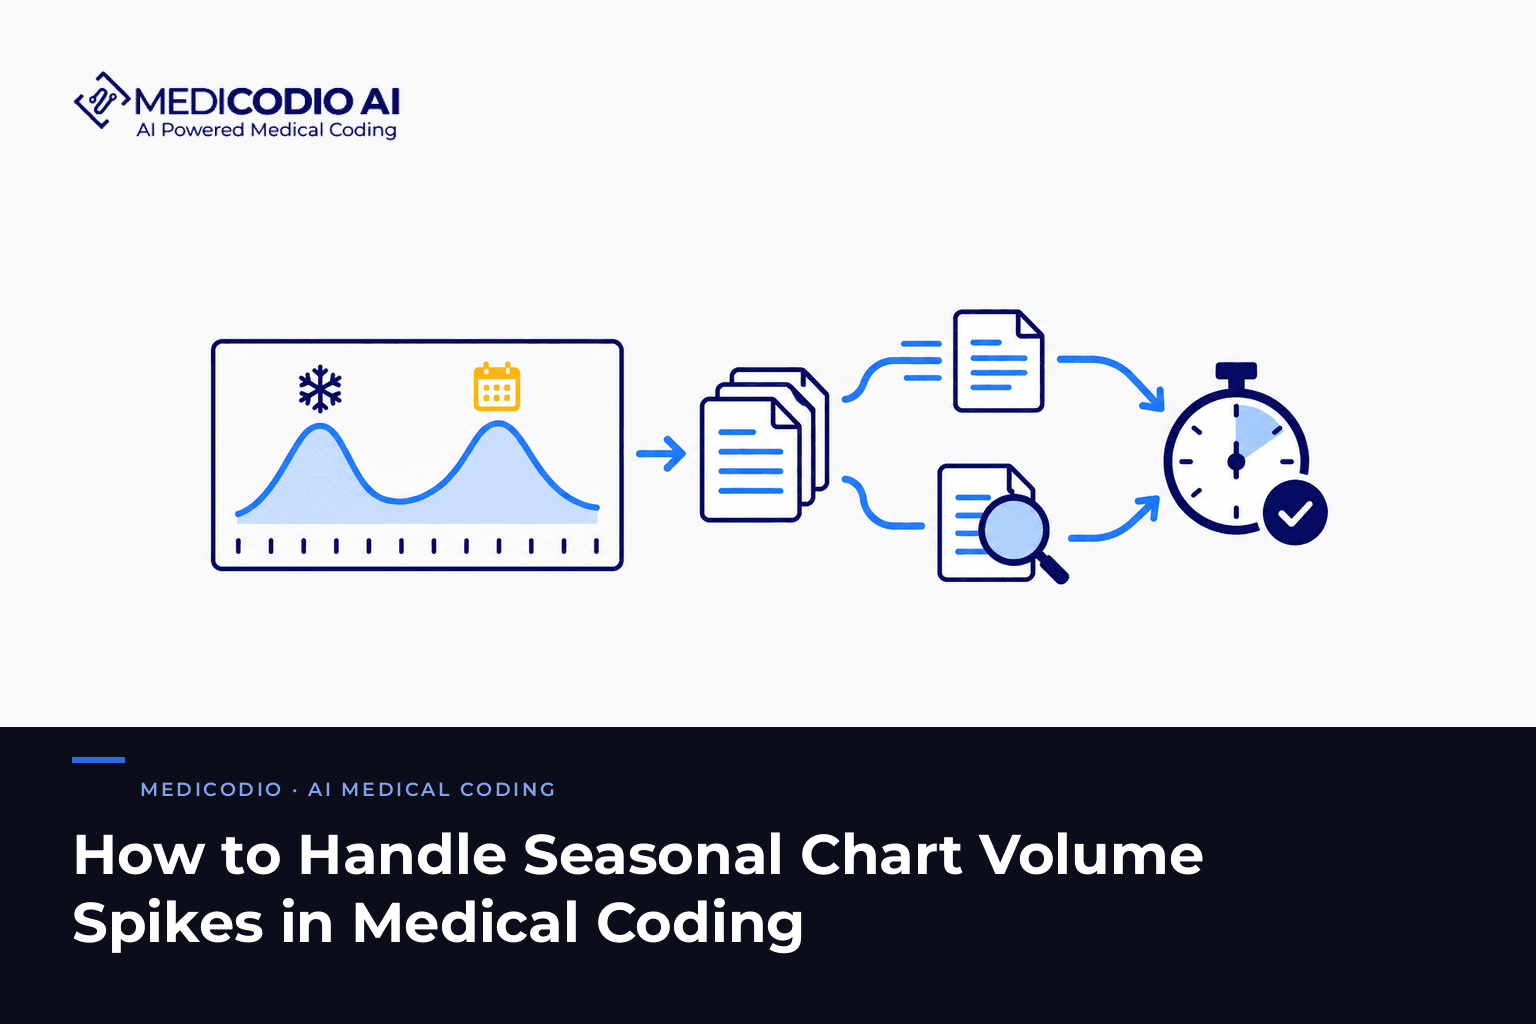
Handle seasonal chart volume spikes by forecasting your own volume curve from historical data at the specialty level, then building capacity that flexes without permanent hiring. Route routine, well-documented charts through autonomous coding and reserve certified coders for complex documentation, so turnaround holds when volume climbs.
Two seasonal curves drive most of this, and they do not peak together. Respiratory illness lifts emergency and outpatient encounters through winter, while elective and procedural volume concentrates at the end of the calendar year. MediCodio AI's CODIO AI engine addresses the capacity side of both: AutoPilot codes eligible charts with complete documentation without human review, and CoPilot routes charts with thin or contradictory documentation to certified coders who review and finalize them. Capacity moves with volume rather than with your hiring calendar.
Why do medical coding volumes rise in certain seasons?
Two distinct patterns produce most seasonal coding load, and conflating them is why staffing plans miss.
Respiratory season raises encounter counts. The CDC reports that US flu activity usually peaks between December and February, though the peak month within that window has moved considerably from season to season. Flu-driven encounters are mostly evaluation and management work in emergency departments, urgent care, and primary care, so the coding load arrives as volume rather than complexity.
Elective and procedural volume concentrates at year end. A study of adult elective anesthesia caseload across Florida and Texas locations of a large multistate practice found daily elective caseloads roughly 20 percent higher in December than in the other eleven months, in each of 2017, 2018, and 2019, with January running below the rest of the year (Piersa et al., Anesthesiology, 2021). Colonoscopy volume rose in December while CABG volume did not, separating elective scheduling from urgent care. The data cover two states and three years, so treat the pattern as evidence rather than a law.
That second finding carries the most useful planning consequence in this article: a December surge is followed by a January trough. Permanent hiring aimed at the peak leaves you carrying cost into the slowest month.
| Organization | Typical seasonal load |
|---|---|
| Hospitals and health systems | Winter respiratory encounters in the ED and outpatient settings, then year-end elective procedures |
| RCM and billing companies | Each client's curve, across different specialties and payer rules |
| Ambulatory surgery centers | Year-end procedural concentration, often GI and orthopedic cases |
| Physician groups | Respiratory visits, annual wellness and preventive visits, new-year benefit resets |
Not every organization carries both curves. A single-specialty orthopedic ASC sees the year-end pattern and little of the respiratory one. A pediatric practice sees the reverse. Build your plan from your own history rather than from a seasonal narrative.
How do seasonal spikes affect coding operations?
Volume does not break coding operations on its own. The damage comes from the gap between arrival rate and completion rate, which compounds daily once it opens.
Turnaround extends first , because charts queue before anyone notices a backlog. Backlog then accumulates at the rate of the gap, so a center receiving 400 charts a day and completing 360 adds 800 charts over a month of business days. Claim submission slips behind the coding date, which pushes cash later in the quarter than the volume that produced it. For hospitals and health systems, coding-related DNFB rises and gets reported upward. For RCM and billing companies, the pressure lands on several client SLAs at once wherever those clients share a seasonal pattern, which is worth checking against your own book rather than assuming either way.
Quality moves last and matters most. Deadline pressure shortens review on the charts that most need it, which during a procedural peak are the operative notes carrying separate-reporting and modifier decisions. Those errors surface a quarter later, long after the volume that caused them.
How do you forecast your own seasonal curve?
Pull two or three years of your own chart arrival data by month, then break it down three ways before you plan anything.
By specialty and chart type. A 20 percent overall rise means nothing operationally if it lands entirely in orthopedic operative notes and your orthopedic coder takes leave in December. Count arrivals by specialty, and separate E&M volume from procedural volume, because they consume different coder skills at different speeds.
By completion capacity, not headcount. Your capacity is charts completed to your quality standard per week, measured from your own history. Writing for AAPC, Pam Brooks (MHA, CPC, COC, PCS) states in Measuring Coder Productivity: A How-to Guide that there is no national standard for the appropriate number of cases to be coded each hour. A borrowed benchmark will not tell you what your team does, so measure it.
By the gap. Put forecast arrivals next to measured capacity, week by week, through the season. The output is a number of charts you will be short, in specific weeks, by specialty. That number is the thing you plan against, and it is also what tells you whether the answer is overtime, outside capacity, automation, or a combination.
Then plan for a window rather than a date. The CDC data above shows the respiratory peak has landed anywhere from December to March across four decades. A plan that activates in a defined window and stands down on a trigger will hold up better than one built for a month you picked in advance.
How do you add coding capacity for a peak you cannot time precisely?
Three instruments exist, and they differ in lead time, cost shape, and how fast you can reverse them.
Permanent hiring carries the longest lead time, because a new coder needs onboarding on your client rules, payer policies, and specialty patterns before reaching full productivity, and it leaves fixed cost in the January trough. Outsourced capacity moves faster and reverses on contract terms, at a rate that usually excludes quality assurance and rework. Automation works differently: it moves a share of charts out of the hours-based queue entirely.
That is where per-chart routing earns its place. Complete charts flow through AutoPilot for fully autonomous coding. Charts where the documentation is thin or contradictory stay in CoPilot, where certified coders review and finalize the output, each suggested code arriving with the documentation passage and the compliance rule behind it. The qualifying charts clear without consuming the coder hours your operative notes need, and the capacity does not reverse out in January, because you are not carrying it as headcount. MediCodio AI reports 45% more output per coder, measured against a manual baseline: same team, same charts, before and after.
How much of your volume qualifies depends on how consistently your clinicians document, so measure it on your own charts before planning around it. Nothing runs autonomous on day one: everything starts in review, and the lane widens only as first-pass accuracy is proven on your charts, audited by your team. Start that evaluation before your season rather than inside it.
How should coding teams manage the backlog during peak weeks?
Work the queue by what releases cash and what risks quality, not by arrival order.
Separate documentation holds from coding-ready work. Charts waiting on a provider query are not a coding capacity problem, and counting them as one sends you hiring for the wrong thing. Dispatch those queries and track them separately.
Prioritize by deadline and value, then by age. Client SLA dates, timely filing limits, and high-value procedural claims come before routine charts that arrived earlier.
Route routine and complex volume apart. Keep your most experienced coders on operative notes, specialty cases, and anything with modifier or NCCI exposure . Routine E&M volume should not be competing for that attention.
Set an escalation trigger before the season. Define the backlog level and turnaround threshold that activate outside capacity, and name who decides. A trigger agreed in October gets used; one debated in January does not.
Protect the quality sample. Audit through the peak at the same rate, because this is when drift happens and when you most need to know about it.
Chart queue and lifecycle views make this workable at volume, since every chart sits in one status bucket and the backlog becomes a number on a screen rather than a question someone has to answer. Why coding backlogs grow despite more hiring covers the structural version of this problem, the one that is not seasonal at all.
Which metrics should you monitor during peak periods?
Weekly during the season, not monthly.
| Metric | What it tells you | Why it matters at peak |
|---|---|---|
| Charts received vs. charts completed | The daily gap | The gap, not the backlog total, predicts where you land in four weeks |
| Backlog by age and specialty | Where the queue is concentrated | A backlog in one specialty is a staffing problem; across all, a capacity problem |
| Coding turnaround time | Receipt to billing release | The number your clients and your CFO already watch |
| Charts on documentation hold | Query volume and response time | Separates a CDI bottleneck from a coding bottleneck |
| First-pass accuracy on the audit sample | Whether quality is drifting | Errors made at peak surface as denials a quarter later |
| Rework rate | Charts returned after release | Rising rework means your effective capacity is lower than it looks |
Compare each against the same weeks last year rather than against the month before. Seasonal comparisons need seasonal baselines.
Where this leaves your seasonal plan
Forecasting tells you which weeks will be short and in which specialties. Prioritization decides what gets coded first. Neither creates capacity, and the instrument you pick for that gap decides whether the peak costs you turnaround, quality, or payroll you carry through the slow months after it.
Routing routine volume through AutoPilot while certified coders handle the documentation-dependent cases in CoPilot adds capacity that scales with the season and needs no unwinding afterward. MediCodio AI reports turnaround under 24 hours, measured at enterprise volume and inclusive of certified-coder review.
Sources
- CDC, Flu Season , page dated September 26, 2025. Peak timing between December and February; peak-month distribution across the 1982-83 through 2023-24 seasons.
- Piersa AP, Tung A, Dutton RP, Shahul S, Glick DB. "December Is Coming: A Time Trend Analysis of Monthly Variation in Adult Elective Anesthesia Caseload across Florida and Texas Locations of a Large Multistate Practice." Anesthesiology 135, no. 5 (2021): 804-812. Elective caseload roughly 20 percent higher in December, 2017 to 2019.
- Brooks, Pam (MHA, CPC, COC, PCS). Measuring Coder Productivity: A How-to Guide , AAPC. No publication date shown on the page. States there is no national standard for cases coded per hour.