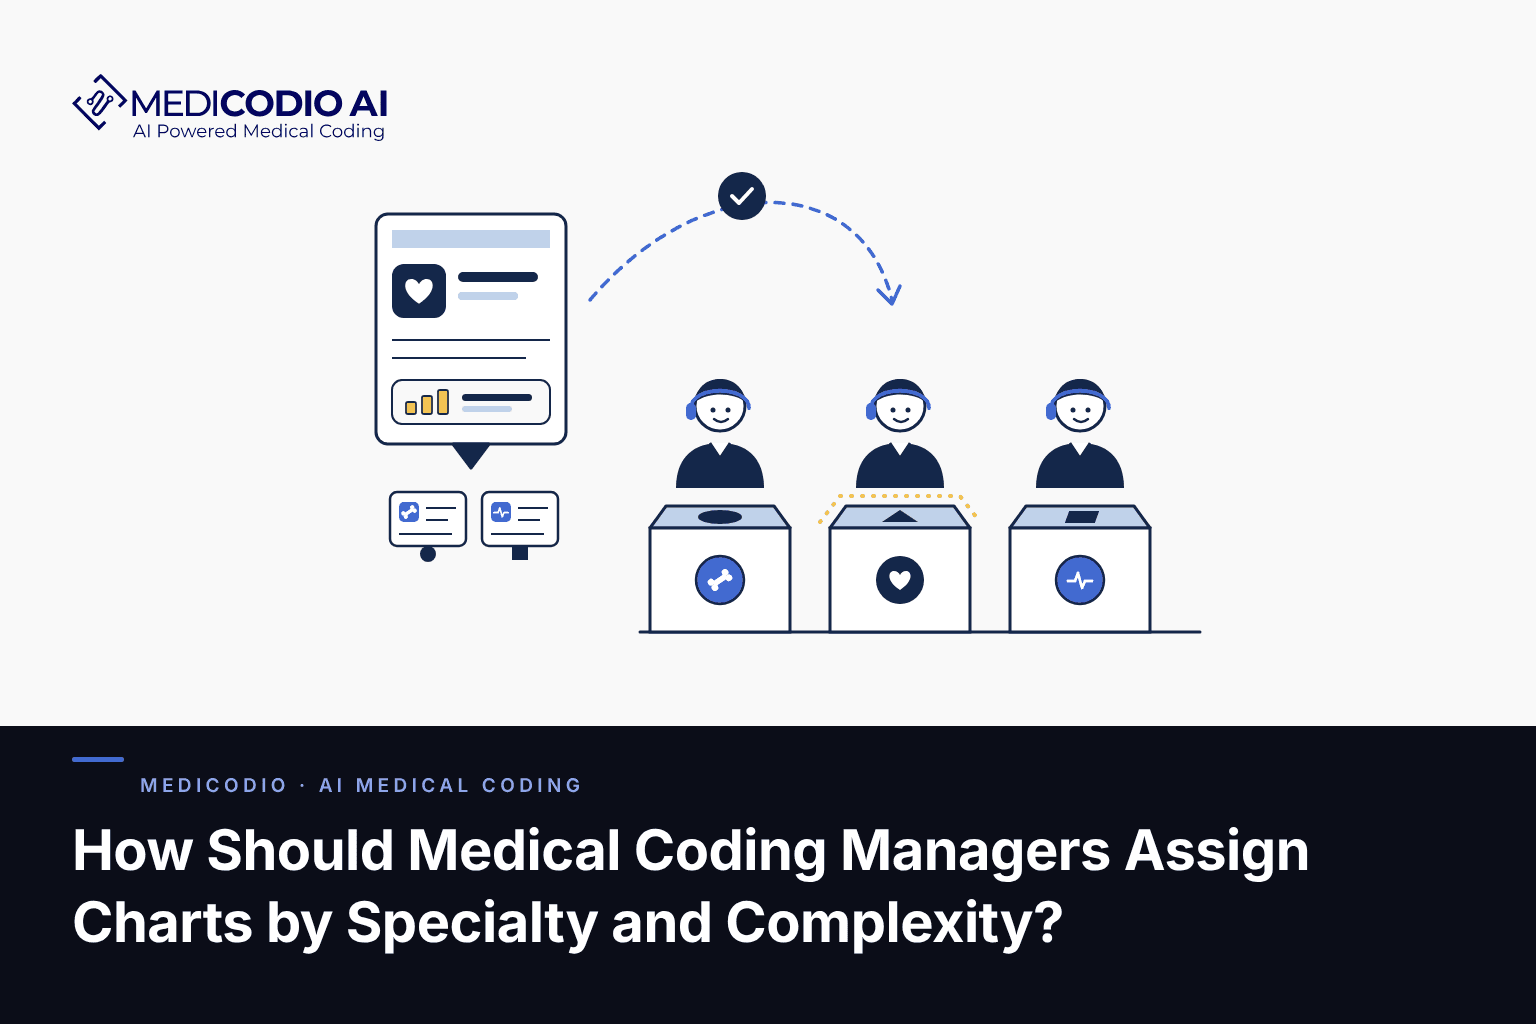
Assign coding work by weighing four things together: the specialty competency a chart needs, how complex the case is, which coders have capacity, and what the turnaround commitment is. Treating any one of those as the whole answer produces uneven workloads, reassignments and denials that trace back to the queue rather than the coder.
Assigning charts and routing charts are two different decisions
Most discussions of coding work assignment collapse two decisions that have different owners.
Assignment puts a chart in front of a named person, based on specialty competency, certification, audit history, workload and shift coverage. A manager makes this call.
Routing moves a chart through a workflow, based on documentation completeness and code-set scope. A rules engine or coding platform can make this call.
The distinction matters when you evaluate software, because a tool that routes well may do nothing about allocation, and most vendor material does not say which it means.
Why does manual chart assignment slow coding teams down?
Manual allocation works until volume or specialty mix outgrows one person’s attention. Three failure modes appear first.
Assignment consumes a supervisor’s morning. A manager who hand-distributes charts triages instead of auditing, coaching or clearing escalations. That cost sits in the supervisor’s hours, so productivity reporting never shows it.
Charts queue behind the wrong person. A surgical backlog sits with one credentialed coder while two coders with capacity cannot take those cases. Backlog by specialty reveals this; total backlog hides it. Coding backlogs that grow despite additional hiring often have this shape.
Open pools invite cherry-picking. When coders select their own work, straightforward charts tend to move first and complex ones age at the back of the queue. The queue design causes that, not the coders, which is why the fix is a routing rule rather than a conversation about attitude.
How to assign medical coding charts: a six-step checklist
Run every chart through the same six steps. The sections below expand steps 2 through 6.
- Identify setting and specialty. Outpatient, ED, professional fee or inpatient, and which service line. This decides who is eligible before anything else.
- Check documentation readiness. Look for laterality, approach, findings, and time where it drives the code. Flag gaps for query now, not mid-chart.
- Assess complexity at intake. Procedure count, comorbidity load, edit exposure. Add flags after preliminary coding if the chart proves harder than it looked.
- Filter for eligible coders. Demonstrated competency in that specialty and setting, plus recent audit performance in that specialty.
- Choose among the eligible. Queue depth, remaining shift, how long the chart has waited, and the turnaround commitment.
- Assign an owner and an escalation path. Record who holds the chart and where it goes if they cannot finish it. When no eligible coder has capacity, escalate rather than downgrade.
Steps 4 and 5 are where teams lose time, because eligibility and availability pull in opposite directions.
A worked example
Illustrative figures, not MediCodio customer data.
A cardiology chart arrives at 2pm with a next-day billing commitment, three procedures and two NCCI pairs needing modifier decisions. Coder A has four years in cardiology, 97% specialty accuracy, eleven charts queued and two hours left. Coder B has eighteen months, 92%, three charts queued and a full shift.
Capacity says B. Competency says A. The deadline breaks the tie: a chart with unresolved modifier decisions and no slack is a poor candidate for the coder more likely to need a second review, because a rework cycle costs more hours than the assignment saved.
Assign to A, move two straightforward charts from her queue to B, and record the swap. The complex chart keeps the right competency and the deadline holds.
Why should coding work be assigned by specialty?
Specialties differ in the documentation a coder reads, not only in the codes they use. An orthopaedic operative note buries laterality and approach in places a coder learns by repetition. Emergency medicine brings volume, variable documentation quality and undiagnosed presentations. Anaesthesia carries time units and concurrency rules that appear nowhere else. Radiology requires precision about what was performed versus what was recommended.
A coder who has read two hundred notes from the same surgeon finds the detail faster, and specialty assignment protects that familiarity.
This does not mean coders cannot work across specialties. A team that never cross-trains creates a single point of failure in every specialty it covers. Assignment should follow demonstrated competency, and competency should be extended deliberately. Denial rates differ by specialty , and a cluster in one service line sometimes points at an assignment gap rather than a coding error.
How should managers assess chart complexity before assigning?
Assess three signals separately: chart complexity, documentation completeness and coding uncertainty. All three get called complexity, and each needs a different response.
| Signal | What it means | What it calls for |
|---|---|---|
| Chart complexity | Multiple procedures, comorbidities, sequencing, bundling, unit calculations | An experienced coder in that specialty. More time, not more people |
| Documentation completeness | Missing laterality, absent approach, undescribed procedure | Query or CDI. A stronger coder cannot create documentation that is not there |
| Coding uncertainty | Conflicting payer policy, a revised guideline, an unfamiliar edit pair | A reference or subject-matter expert. A knowledge gap, not a skill gap |
Getting this wrong wastes your scarcest resource. An incomplete note sent to your strongest surgical coder spends an expert’s hour on a problem only the provider can fix.
Edit exposure makes a useful objective signal, and it moves: CMS updates the NCCI procedure-to-procedure and MUE files quarterly, with replacement files between cycles. A chart carrying several edit pairs needs someone who has worked them before.
How do you match charts to coder expertise?
Match on competency, recent audit performance in that specialty, procedure familiarity and current capacity. A skill matrix holds these in one place, so assignment becomes a lookup rather than recall.
| Dimension | What to record | What it decides |
|---|---|---|
| Specialty competency | Proficient, developing, not trained | Which queues a coder can take from |
| Setting experience | Outpatient, ED, professional fee, inpatient | Whether a chart type is in scope |
| Certifications | Current and specialty credentials | Compliance and client commitments |
| Audit performance | Accuracy by specialty, not pooled | Where high-risk charts go |
| Procedure familiarity | Procedures or surgeons worked regularly | Speed on charts that repeat |
| Current load | Queue depth, hours, planned absence | Whether the rest is usable today |
Two rules keep it working under pressure.
Carry depth of two. One manager on the AAPC forums describes requiring at least two coders able to confidently and correctly code each subspecialty. That is practitioner opinion rather than survey data, and it matches the arithmetic: depth of one turns a holiday into a backlog.
Read accuracy by specialty. A coder with a strong overall rate may carry a weak specialty inside that average, which is exactly what assignment needs to see.
Should your team use specialty queues or a shared pool?
Neither wins universally, and most teams need both. Coding managers describe splitting work by subspecialty, payer, provider, or not at all.
| Model | Favoured when | Watch for |
|---|---|---|
| Specialty queues | Two or more competent coders per specialty; documentation patterns differ sharply; denials cluster by service line | Depth of one; idle queues beside backed-up ones |
| Shared pool | Low or unpredictable volume; small team; homogeneous charts | Cherry-picking; complex charts ageing at the back |
| Hybrid | Two or three specialties carry most volume, rest is long-tail | Unclear ownership at the boundary |
Most teams land on the hybrid. Whichever you run, write down what happens when a chart cannot be coded as assigned. Reassignment without a rule is how charts get touched three times, and DNFB that climbs on a fully staffed team often traces back to it.
How can technology support chart routing?
Software helps with routing and with the visibility that makes assignment possible. It helps least with judging who should take a chart.
MediCodio AI’s CODIO AI engine works on the routing side. Complete charts flow through AutoPilot for fully autonomous coding. Charts where the documentation is thin or contradictory stay in CoPilot, where certified coders review and finalize the output. That decision is made per chart on documentation quality.
Three published capabilities support the surrounding work. Chart Queue and Lifecycle puts every chart in one lifecycle bucket on a dashboard, the picture assignment decisions need first. Real-Time Compliance resolves NCCI edits, MUE limits and LCD/NCD coverage while the claim is being built rather than after a rejection. Prediction Trail shows the chart passage and guideline behind any assigned code, shortening review without changing who reviews.
Worth stating plainly: this routes charts through workflows by documentation quality. It does not allocate charts to named coders by specialty, certification or workload. That stays with the manager, and any vendor claiming otherwise should demonstrate it on your own worklist.
Which metrics show your assignment process is working?
Track seven: turnaround and backlog by specialty, workload distribution, first-pass accuracy by specialty, reassignment frequency, query rate, and QA findings by cause. Read them together, because each improves in isolation through changes that make the operation worse.
| Metric | What it reveals | Failure mode if read alone |
|---|---|---|
| Turnaround by specialty | Where charts wait | Hides a backed-up queue inside a healthy average |
| Backlog by specialty | Whether capacity matches mix | Flat while one service line ages |
| Workload distribution | Whether the queue is balanced | Even distribution of unequal charts is not balance |
| First-pass accuracy by specialty | Where competency sits | Pooled accuracy conceals a weak specialty |
| Reassignment frequency | Whether assignment rules work | Low numbers can mean coders absorb escalations |
| Query rate | Documentation quality upstream | A rise may be a CDI win, not a coding problem |
| QA findings by cause | Whether errors trace to assignment | Findings by coder invite blame, not diagnosis |
One diagnostic separates a systemic problem from an individual one. If every coder is slow on the same specialty, the issue is documentation, reference material or assignment rules. If one coder is slow where others are not, that is coaching.
Resist a single charts-per-hour target. MDaudit , a coding audit vendor, argues for measures stratified by case complexity, since a straightforward outpatient chart and a complex inpatient chart should not share a standard. For context, charts per coder per day and turnaround without sacrificing accuracy beat one number.
Book a demo and see how chart lifecycle and code-level evidence work in one view.
Sources
- CMS Medicare NCCI Edits . Quarterly PTP and MUE updates with off-cycle replacement files.
- CMS Medicare NCCI PTP Edits . Column One and Column Two edit behaviour.
- AAPC forum discussion on how coding departments are split . Practitioner discussion, not survey data.
- MDaudit, Coder Productivity Metrics That Matter in 2026 . Vendor analysis.
- For The Record, Coders Under the Gun , Lee DeOrio, Vol. 29 No. 8, August 2017. Trade reporting on workload allocation.